Introduction
In the ever-evolving landscape of transportation data platforms, many options exist for transportation agencies and consultants. However, most of these platforms are rigid, off-the-shelf solutions that lack the flexibility and customization required to address unique challenges. What if there was a platform that empowered transportation professionals to tackle those one-of-a-kind questions and access tailored data to fuel their projects?
Enter the AirSage Transportation Platform launched in April 2024. Built with ease-of-use and customization in mind, this mobility data tool caters to the specific needs of transportation professionals. With five modules to choose from - all of which are fully customizable - AirSage offers a comprehensive solution for data-driven decision making.
In this blog post, we will delve into the Trip Matrix O-D Data module, showcasing select use cases that demonstrate the power and versatility of the AirSage Transportation Platform.
Select Use Cases for O-D Trip Matrix
To understand commute patterns, we need to use AirSage O-D Trip Matrix to run the zonal structure for an entire region.
Using Indianapolis as an example, we ran the zonal structure for all of Indianapolis and filtered by Trip Purpose to identify Home Based Work trips on Mondays and Fridays compared to midweek days (Tuesday, Wednesday, Thursday). To identify morning commute patterns on these days, we then filtered by Hour Aggregation and looked at the morning peak.
The results showed that in May 2023 Home Based Work trips were 16% of total trips during midweek and were 13% of total trips on Mondays and Fridays. In June 2023, Home Based Work trips were 14% of total trips during midweek and were 12% of total trips on Mondays and Fridays. These numbers suggest that in general fewer people were driving to work in June compared to May. Additionally, in both months fewer people were driving to work on Mondays and Fridays than on midweek days.
Using the same scenario as above, we filtered by morning peak. The results showed that in May 2023, 153,040 Home Based Work trips were during the morning peak on midweek days and 135,264 Home Based Work trips were during the morning peak on Mondays and Fridays. In June 2023, 127,592 Home Based Work trips during morning peak occurred on midweek days and 110,431 Home Based Work trips during morning peak were on Mondays and Fridays.
These numbers reveal that the same phenomenon occurred in June 2023 as in May 2023 with more commuters going to work during morning peak on midweek days than on Mondays and Fridays. Comparing the two months also reveals that more commuters went to work during morning peak in May than in June 2023.
To understand the potential market of trips currently not being captured by transit, we need to run the AirSage O-D trip matrix for zones served by specific transit corridors.
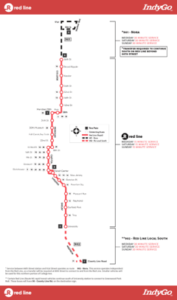
Continuing with Indianapolis as an example, we looked at zones served by the IndyGo Redline in June 2023. Based on AirSage data, Total Person Trips between the zones served by the Redline in June 2023 equaled 23,068. We further analyzed the data by utilizing Day Aggregation which showed that 14,645 trips occurred on weekdays and 8,418 trips occurred on weekends. If we wanted to delve deeper, we could also look at Trip Purpose (Home Based Work, Home Based Other, Non Home Based) and/or Hour Aggregation (Morning Peak and Afternoon Peak)
With this information, we could then compare observed ridership of IndyGo during the same month (June 2023) and determine whether the Redline is serving demand on those days of the week (weekday vs. weekend) and at those times (morning vs. afternoon peak).
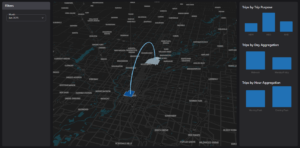
The below screenshot is a visualization within the AirSage Transportation Platform of two zones served by the Redline and displays the Trip Purpose, Day Aggregation and Hour Aggregation of each trip made between those zones.


By using the AirSage O-D Trip Matrix module in this circumstance, transportation professionals can make more informed planning and operational decisions and answer the question “How can our service capture more of the travel occurring among the zones served by our transit lines?”
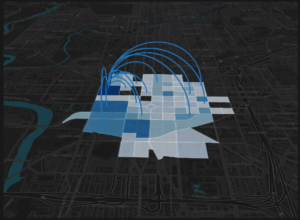
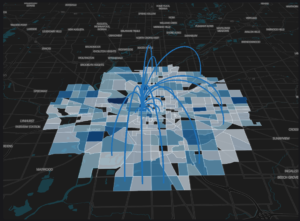
To determine whether sufficient infrastructure is in place to service potential walkable or bikeable trips, we must first use the AirSage O-D Trip Matrix module to isolate short distance trips with walkable (0 to 1 mile) and bikeable (0 to 5 mile) distances within the city. Pictured below are two visualizations from the AirSage Transportation Platform - one of walkable trips within the city center of Indianapolis and the other of bikeable trips within the city center in June 2023.


Walkable Trips (0 to 1 mile) Bikeable Trip (0 to 5 miles)
With the AirSage trip data on hand, we can then examine Indianapolis's existing infrastructure, such as sidewalks and bike paths, and determine if they sufficiently serve all potential walkable or bikeable trips. This data-driven approach can help identify gaps in infrastructure and inform targeted investment decisions for future urban planning projects.
Conclusion
In conclusion, the AirSage Transportation Platform is transforming the way transportation professionals approach data analysis and decision making. Its customizable nature enables users to address unique questions and tailor data to fit their specific projects. By offering modules such as O-D Trip Matrix, AirSage provides a comprehensive solution for travel demand modeling and beyond.
To learn more about the AirSage Transportation Platform, click here: https://airsage.com/solutions/airsage-transportation-platform/