Enhancing Safety Studies With Vehicle Insight – Webinar Recap
Introduction:
On Tuesday, October 3, 2023, AirSage hosted a webinar highlighting the benefits and applications of connected vehicle (CV) events data called Enhancing Safety Studies With Vehicle Insight. Speakers included Chris Wichman, Transportation Solutions Advisor at AirSage, and Soroush Salek, Director of Traffic Engineering at CIMA+. Chris spoke about the nuances of CV data and how it’s procured, processed, and cleansed by AirSage, while Soroush explained how he utilized AirSage CV Events data to improve York’s (Ontario, Canada) Regional Safety Plan.
AirSage – A Pioneer in Location Intelligence
To begin, Chris provided some background on AirSage and its more than 20 year history in procuring, processing, and cleansing location data. He explained that AirSage began working with connected vehicle data over a decade ago. Throughout this time, AirSage has focused heavily on privacy and security and remains fully compliant with all relevant regulations (including CPRA and GDPR).
What Is CV Data and Where Does It Come From?
Next, Chris ensured the audience understood the term CV and where it comes from. A CV, or connected vehicle, refers to any vehicle that's equipped with a communication system that allows it to interact either with other vehicles, infrastructure, or an external network.
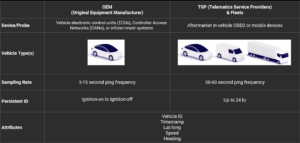
Chris then described the sources of CV data and shared a chart depicting the attributes of each. He noted that, “irrespective of the source, the core attributes of connected vehicle data (timestamp, coordinates, speed and heading) are really the key to leveraging this data for transportation, engineering, and planning.”
AirSage’s Role
CV data is very big data. Chris explained, “The sheer volume of this data is really the biggest challenge in working with it, particularly for consultants or public agencies.” It is difficult to parse through especially when consultants and agencies have many other competing priorities. That’s where AirSage steps in. AirSage unlocks the value of connected vehicle data and helps clients avoid the headaches of working with it.
AirSage’s Safety Products
Chris listed the two AirSage data products used for transportation safety: vehicle speeds and vehicle events. While AirSage does support link level vehicle data, it also offers trajectory data, which has a better ability to answer very specific and unique questions. Chris shared the map below as an example, which shows how isolating a single vehicle’s trip and string of speed readings can help clients understand how an individual vehicle is a proxy for a driver interacting with the roadway network.
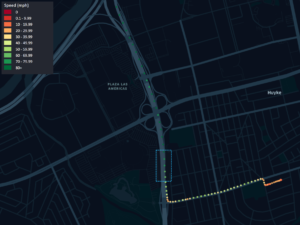
With this disaggregate data, clients can answer questions like: ‘how does the speed of this vehicle change in proximity to an external roadway characteristic, like a curve or a video enforcement camera?’. Chris concluded: “Aggregated statistics can be interesting and meaningful, but disaggregate speeds are powerful in the ability to assess behaviors and risk, say pre- and post-implementation of some safety countermeasure.”
Vehicle events are reported in a separate dataset from the vehicle speeds dataset. They represent movements exceeding a preset G-force threshold above defined time parameters, which triggers the reporting of an event. These include harsh braking, harsh acceleration and harsh cornering events. Chris noted, “There's no standardized definition of what the trigger is of an event across OEMs and TSPs. So, it's important to understand what the thresholds are and the relative sensitivity when working with this type of data.”
Chris shared an example of a few days of events in Atlanta (image 1) and then zoomed in on one particular interchange (image 2).
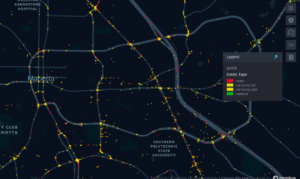
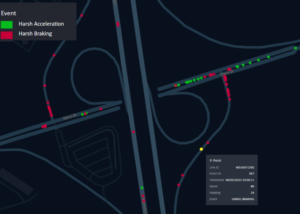
He explained, “While the frequency zoomed out at a regional scale can help understand the magnitude of risk and help clients do network level screening, the events data also carries attributes for the G force and speed at the time of the event, which can allow for some calculations of a severity metric as well.” The data doesn’t only show where an event has occurred, but it also helps characterize details of the specific event.
Benefits of AirSage to CIMA+
Chris listed three ways AirSage provides benefits to clients like CIMA+: (1) access to quality data, (2) expertise in curating the data down to the geographic area or even corridors of interest for a particular project, and (3) ability to conflate - or align the GPS coordinates - to the client’s preferred roadway network. Chris explained, “For the data output for CIMA+, we included Soroush’s client’s unique segment IDs and intersection IDs, which provided a turnkey ready data set to leverage in his analysis.”
CIMA+ Introduction to York Regional Safety Plan
Soroush began his presentation by sharing some vehicle collision statistics about the York region, including: “In 2018, 2,431 people unfortunately lost their lives on Canadian roads, and 602 of them were in Ontario. 35 of those fatalities occurred in the York region.” When York looked at the past five years of collision data, they saw a general decreasing trend; however, they felt that the number of injury collisions and fatal collisions in York region was still too high, so they contracted with CIMA+ to develop a five-year road safety strategic plan.
Data Analysis Overview
Soroush explained that following the principles of a safe system approach and the vision zero philosophy, his team looked into six different phases: (1) review of existing safety programs, (2) public and stakeholder consultation, (3) data analysis, (4) incorporating safety in design and planning and developing (5) an action plan and (6) financial plan for the strategy.
For safety data analysis, the CIMA+ team used a number of data sources and advanced analysis techniques to answer questions such as ‘where are collisions happening, who is involved in collisions and why are they happening?’. Soroush confirmed, “We conducted a variety of analyses such as collision analysis, human factors and analysis, network screening, systemic safety and analysis, safety culture and analysis, and a connected vehicle data analysis.”
CV Data Applications in Safety Planning
Soroush listed various applications of CV data in transportation planning and engineering. He cited traffic operations studies such as travel times studies, traffic diversion and detour planning studies, and transportation planning projects such as regional destination studies. He described, “In recent years, application of connected vehicle data in traveler safety or road safety projects have gained more traction.”
CIMA+ was aware of connected vehicle data applications in network-wide safety analysis, “before-and-after” evaluations of the countermeasures and network wide speed compliance studies, so they decided to use connected vehicle data to support their work on development of the York Traveler Safety Plan.
CIMA+ Obtains AirSage CV Events Data
Soroush’s team obtained CV events data - for May 7 to June 9, 2023 - from AirSage early in the project. The threshold that was used to generate a harsh braking event was 2.5 m/s^2 (~ 0.25G) for a minimum duration of 2 seconds and a maximum duration of 4 seconds. Harsh acceleration had the same threshold but with a minimum duration of 1 second and maximum duration of 5 seconds.
AirSage provided CIMA+ with data that was mapped to and aligned with regional facilities, meaning that events were assigned to unique IDs at intersections and roadway segments along the regional transportation network. CIMA+ combined AirSage’s data with the region's road safety database, which already included information that was being used for basic network screening. CIMA+ augmented that data with more facility characteristics that are useful to conduct systemic safety analysis. The team also added collision data, traffic volume data, and the network screening results to the database. Soroush noted, “Just looking at the overall (CV events) data that we received, we noticed that a majority of the data was harsh braking events – 75% - and about a fourth was harsh acceleration.”
CV Events Data Analysis
Distribution of Events
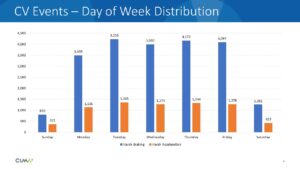
Soroush shared the graph below of the daily distribution of CV Events in the study area. He explained, “As expected on Saturdays and Sundays few events are happening, but there is a peak on Tuesday.”
Another graph prepared by CIMA+ showed the hourly distribution of harsh braking at intersections in blue bars and harsh braking mid block in green bars. What Soroush found interesting was that the peak frequency for harsh braking at intersections generally did not coincide with the AM and PM peak periods; however, harsh braking at mid block locations more closely aligned with the AM and PM peak periods.
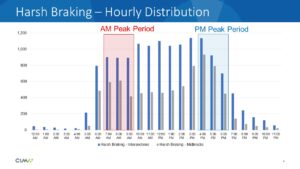
Soroush explained that when his team looked at the hourly distribution for harsh acceleration, they found more harsh acceleration events mid block, but again, it did not follow the AM and PM peak trends they were expecting.
CIMA+ mapped AirSage’s CV events data to the regional transportation network. As expected, municipalities with higher populations and traffic volumes had more events in the dataset.
CV Events and Network Screening Priorities
Soroush next shared a map that compared the frequency of harsh braking and harsh acceleration events with the findings of empirical based network screening ranking.
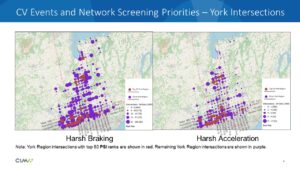
Soroush’s team found that the majority of high priority locations revealed from network screening had a high frequency of both harsh braking and harsh acceleration events. However, some locations not identified by network screening still had a high frequency of events. Soroush confirmed, “These are the locations that can be identified through other ranking systems - one of them being connected vehicle rank.”
CV Data Stability
CIMA+ tested the AirSage data to see how many days of events data it would take to obtain stability in the frequency of the harsh braking and harsh acceleration events across the network. They generated a video that highlighted the average daily frequency of events across the entire network.
The first day of data showed the number of events made on May 7th. The second day (May 8th) showed that the number of events on that day plus May 7th divided by 2 and so on. After seven days of data, the distribution of the events on average was not changing, so they had achieved stability. Soroush stated, “This is good news. It tells us that if we have at least 7 consecutive days of data, we can draw some reliable conclusions in support of network wide safety reviews.”
CV Events Modelling
CIMA+ wanted to incorporate CV events in some of their collision prediction models. They wanted to develop separate models where the connected vehicle events were a dependent variable and predict those events using road and traffic operation characteristics.
They first looked into some correlation indices between connected vehicle data and other variables like collisions, traffic volume, and the facility characteristics. They found that harsh acceleration had a high correlation with the average number of non-fatal collisions, but harsh braking surprisingly did not have a strong correlation.
Then, they looked into the correlation between the events and different impact types. They observed again that harsh acceleration had a significant correlation with variant collision, side swipe collision and turning movement collisions.
Soroush’s team also explored the correlation between CV events with signalized intersections that have minor AADT, major AADT, total AADT, presence of left turn lane, presence of right turn lane, divided roadway and intersection, the number of lanes on major road, and the potential for safety improvement index from network screening. All of them showed significantly high correlation.
Collision Prediction Models
CIMA+ began developing collision prediction models, using the existing safety performance functions that the York region had and incorporating harsh braking and harsh acceleration events as an independent variable. They could incorporate those variables in signalized and unsignalized intersections, for 4-legged and 3 legged intersections, and with the categories of all collisions and fatal injury collisions.
Predicted Harsh Braking and Harsh Acceleration Events at Signalized Intersections
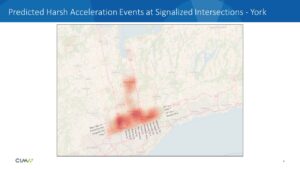
CIMA+ developed separate models to predict CV events for the same categories where CV event was the dependent variable and AADT and some other road characteristics were dependent variables. They developed similar models for similar categories for intersections and mid block locations. Using the developed models for harsh braking, they calculated the frequency of harsh braking across the regional roads displayed by the heat map below. They were also able to do this for harsh acceleration.
Conclusion
To conclude his presentation, Soroush shared a summary of his findings from leveraging AirSage CV data in his team’s safety analyses:
“Connected vehicle data provided us with the opportunity to create a fourth list of priority locations and we used that information in the development of the action plan for the York region to identify locations that certain counter measures could be incorporated.” – Soroush Salek, Director of Traffic Engineering, CIMA+
Next Steps
To watch the full webinar Enhancing Safety Studies With Vehicle Insight, please go to: https://airsage.com/webinars/. If you have further questions or want more information about CV Event (Safety Events) Data, contact AirSage at transportation@airsage.com.